Automatic Paper Analysis
Automatic scientific paper analysis is fast growing area of studies, and due to recent improvements in NLP techniques is has been greatly improved in the recent years. In this post, we will show you how to derive specific insights from COVID papers, such as changes in medical treatment over time, or joint treatment strategies using several medications:
Research described in this paper was conducted together with Vickie Soshnikova. If you want to cite it, please use arXiv:2110.15453. The code is available here.
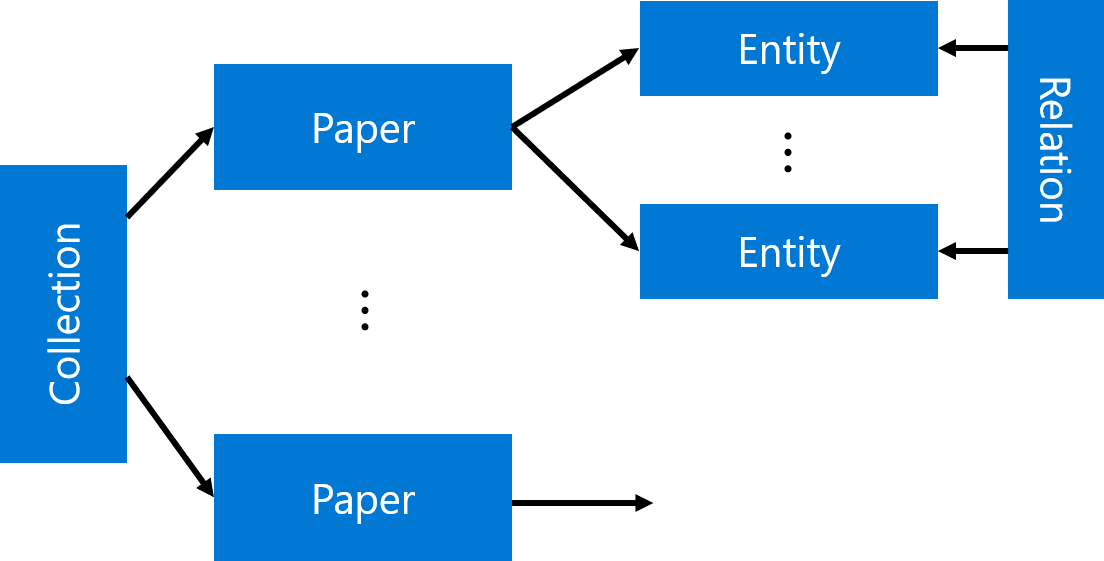
The main idea the approach I will describe in this post is to extract as much semi-structured information from text as possible, and then store it into some NoSQL database for further processing. Storing information in the database would allow us to make some very specific queries to answer some of the questions, as well as to provide visual exploration tool for medical expert for structured search and insight generation. The overall architecture of the proposed system is shown below:
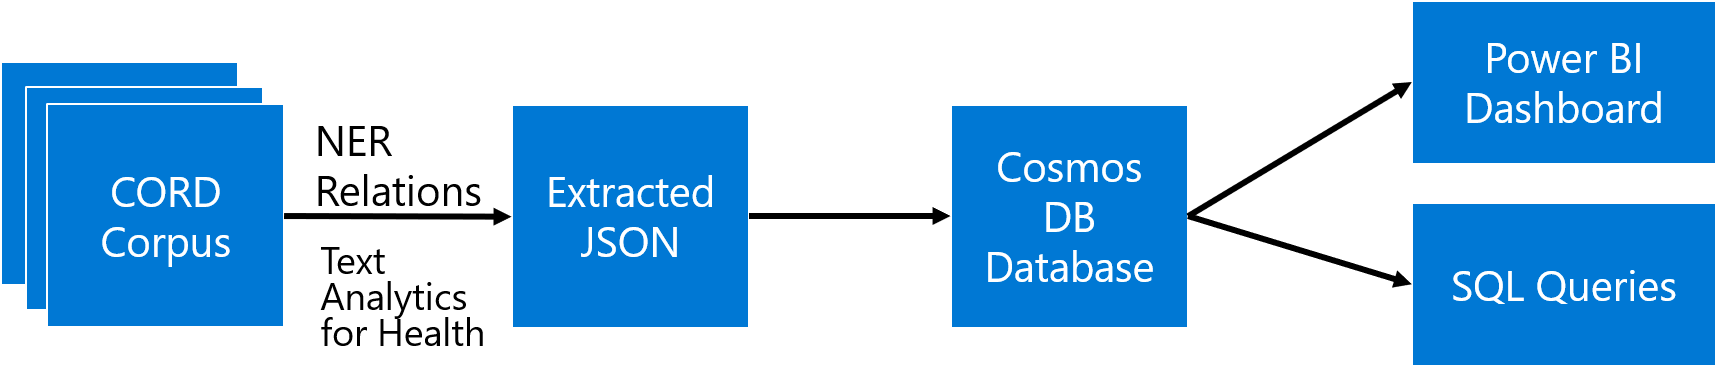
We will use different Azure technologies to gain insights into the paper corpus, such as Text Analytics for Health, CosmosDB and PowerBI. Now let’s focus on individual parts of this diagram and discuss them in detail.
If you want to experiment with text analytics yourself - you will need an Azure Account. You can always get free trial if you do not have one. And you may also want to check out other AI technologies for developers.
COVID Scientific Papers and CORD Dataset
The idea to apply NLP methods to scientific literature seems quite natural. First of all, scientific texts are already well-structured, they contain things like keywords, abstract, as well as well-defined terms. Thus, at the very beginning of COVID pandemic, a research challenge has been launched on Kaggle to analyze scientific papers on the subject. The dataset behind this competition is called CORD (publication), and it contains constantly updated corpus of everything that is published on topics related to COVID. Currently, it contains more than 400000 scientific papers, about half of them - with full text.
This dataset consists of the following parts:
- Metadata file Metadata.csv contains most important information for all publications in one place. Each paper in this table has unique identifier
cord_uid (which in fact does not happen to be completely unique, once you actually start working with the dataset). The information includes:- Title of publication
- Journal
- Authors
- Abstract
- Date of publication
- doi
- Full-text papers in
document_parses directory, than contain structured text in JSON format, which greatly simplifies the analysis. - Pre-built Document Embeddings that maps
cord_uids to float vectors that reflect some overall semantics of the paper.
In this post, we will focus on paper abstracts, because they contain the most important information from the paper. However, for full analysis of the dataset, it definitely makes sense to use the same approach on full texts as well.
What AI Can Do with Text?
In the recent years, there has been a huge progress in the field of Natural Language Processing, and very powerful neural network language models have been trained. In the area of NLP, the following tasks are typically considered:
- Text classification / intent recognition
- In this task, we need to classify a piece of text into a number of categories. This is a typical classification task.
- Sentiment Analysis
- We need to return a number that shows how positive or negative the text is. This is a typical regression task.
- Named Entity Recognition (NER)
- In NER, we need to extract named entities from text, and determine their type. For example, we may be looking for names of medicines, or diagnoses. Another task similar to NER is keyword extraction.
- Text summarization
- Here we want to be able to produce a short version of the original text, or to select the most important pieces of text.
- Question Answering
- In this task, we are given a piece of text and a question, and our goal is to find the exact answer to this question from text.
- Open-Domain Question Answering (ODQA)
- The main difference from previous task is that we are given a large corpus of text, and we need to find the answer to our question somewhere in the whole corpus.
In one of my previous posts, I have described how we can use ODQA approach to automatically find answers to specific COVID questions. However, this approach is not suitable for serious research.
To make some insights from text, NER seems to be the most prominent technique to use. If we can understand specific entities that are present in text, we could then perform semantically rich search in text that answers specific questions, as well as obtain data on co-occurrence of different entities, figuring out specific scenarios that interest us.
To train NER model, as well as any other neural language model, we need a reasonably large dataset that is properly marked up. Finding those datasets is often not an easy task, and producing them for new problem domain often requires initial human effort to mark up the data.
Pre-Trained Language Models
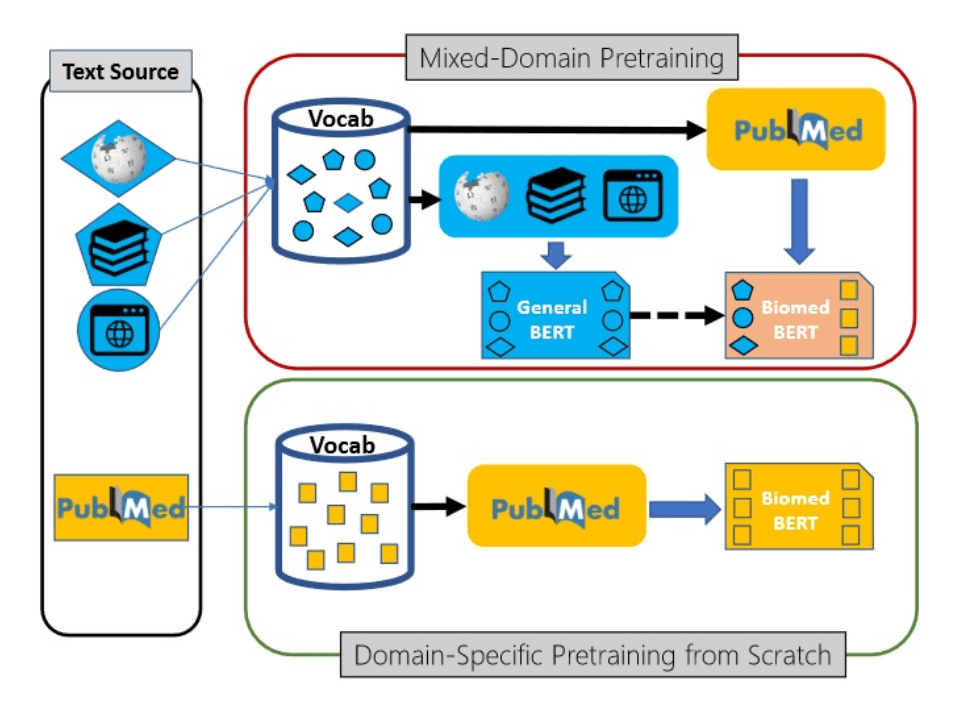
Luckily, modern transformer language models can be trained in semi-supervised manner using transfer learning. First, the base language model (for example, BERT) is trained on a large corpus of text first, and then can be specialized to a specific task such as classification or NER on a smaller dataset.
This transfer learning process can also contain additional step - further training of generic pre-trained model on a domain-specific dataset. For example, in the area of medical science Microsoft Research has pre-trained a model called PubMedBERT (publication), using texts from PubMed repository. This model can then be further adopted to different specific tasks, provided we have some specialized datasets available.
Text Analytics Cognitive Services
However, training a model requires a lot of skills and computational power, in addition to a dataset. Microsoft (as well as some other large cloud vendors) also makes some pre-trained models available through the REST API. Those services are called Cognitive Services, and one of those services for working with text is called Text Analytics. It can do the following:
- Keyword extraction and NER for some common entity types, such as people, organizations, dates/times, etc.
- Sentiment analysis
- Language Detection
- Entity Linking, by automatically adding internet links to some most common entities. This also performs disambiguation, for example Mars can refer to both the planet or a chocolate bar, and correct link would be used depending on the context.
For example, let’s have a look at one medical paper abstract analyzed by Text Analytics:
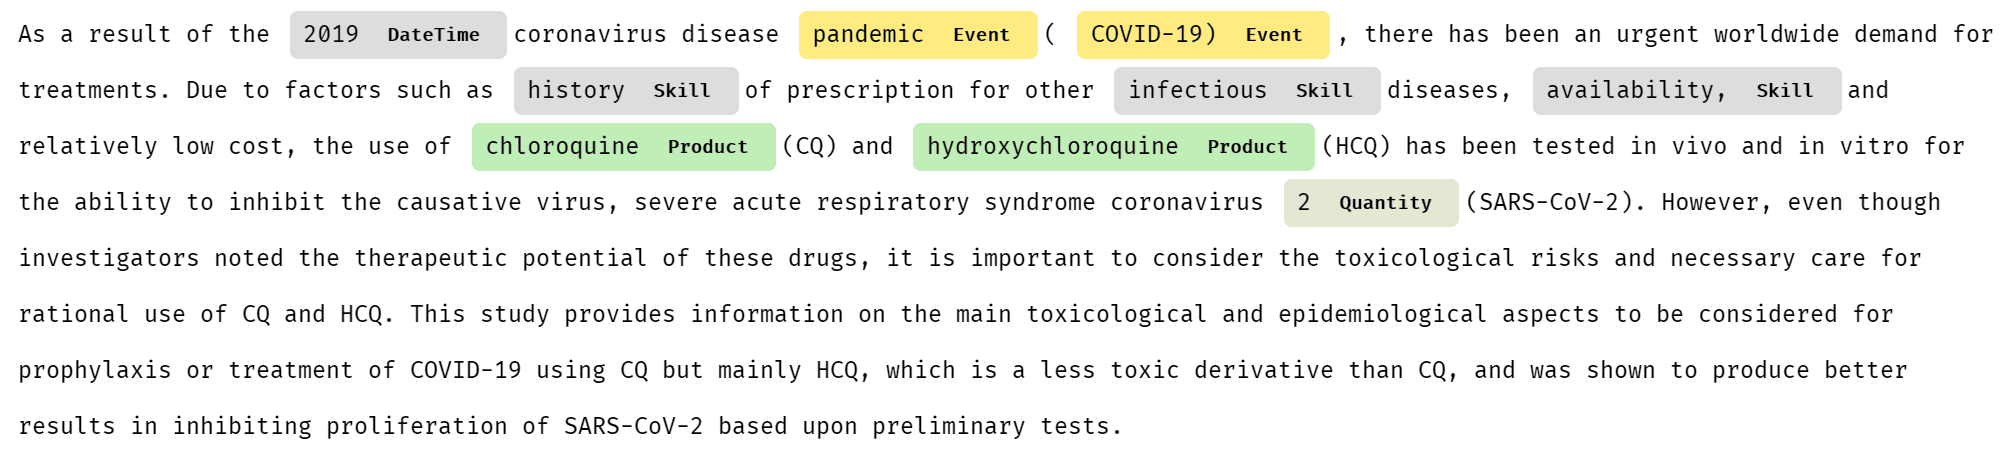
As you can see, some specific entities (for example, HCQ, which is short for hydroxychloroquine) are not recognized at all, while others are poorly categorized. Luckily, Microsoft provides special version of Text Analytics for Health.
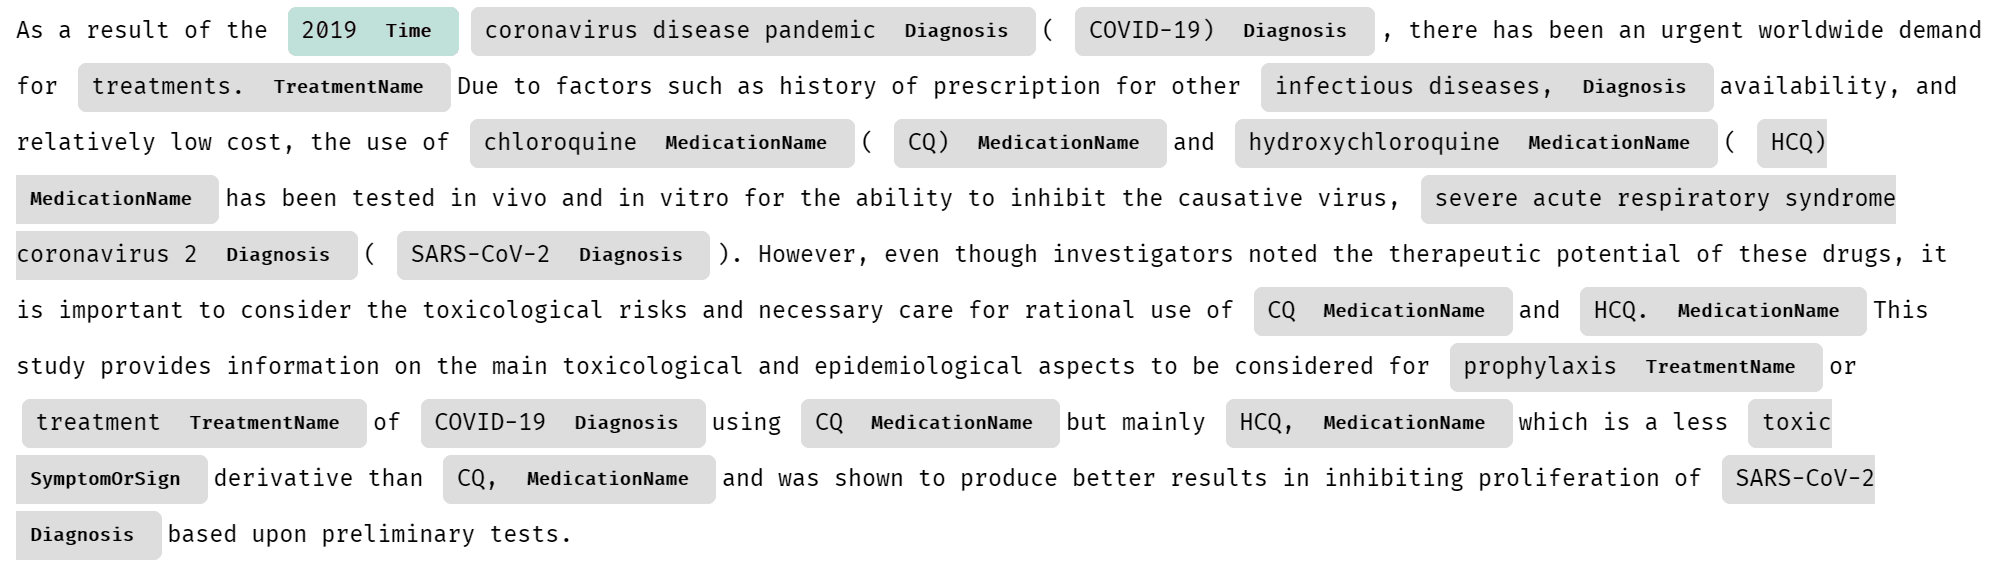
Text Analytics for Health
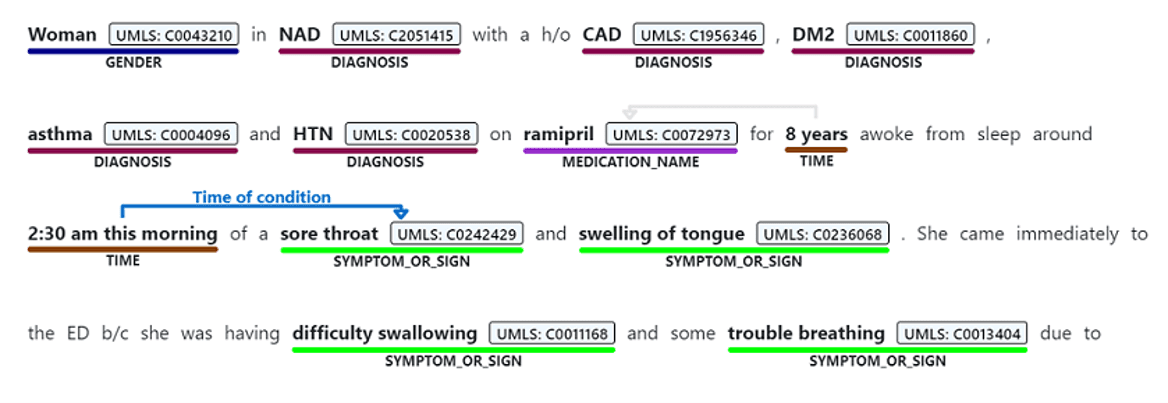
Text Analytics for Health is a cognitive service that exposes pre-trained PubMedBert model with some additional capabilities. Here is the result of extracting entities from the same piece of text using Text Analytics for Health:
Currently, Text Analytics for Health is available as gated preview, meaning that you need to request access to use it in your specific scenario. This is done according to Ethical AI principles, to avoid irresponsible usage of this service for cases where human health depends on the result of this service. You can request access here.
To perform analysis, we can use recent version Text Analytics Python SDK, which we need to pip-install first:
pip install azure.ai.textanalytics==5.1.0b5
Note: We need to specify a version of SDK, because otherwise we can have current non-beta version installed, which lacks Text Analytics for Health functionality.
The service can analyze a bunch of text documents, up to 10 at a time. You can pass either a list of documents, or dictionary. Provided we have a text of abstract in txt variable, we can use the following code to analyze it:
poller = text_analytics_client.begin_analyze_healthcare_entities([txt])
res = list(poller.result())
print(res)
This results in the following object:
[AnalyzeHealthcareEntitiesResultItem(
  id=0, entities=[
     HealthcareEntity(text=2019, category=Time, subcategory=None, length=4, offset=20, confidence_score=0.85, data_sources=None,
        related_entities={HealthcareEntity(text=coronavirus disease pandemic, category=Diagnosis, subcategory=None, length=28, offset=25, confidence_score=0.98, data_sources=None, related_entities={}): 'TimeOfCondition'}),
     HealthcareEntity(text=coronavirus disease pandemic, category=Diagnosis, subcategory=None, length=28, offset=25, confidence_score=0.98, data_sources=None, related_entities={}),
     HealthcareEntity(text=COVID-19, category=Diagnosis, subcategory=None, length=8, offset=55, confidence_score=1.0,
        data_sources=[HealthcareEntityDataSource(entity_id=C5203670, name=UMLS), HealthcareEntityDataSource(entity_id=U07.1, name=ICD10CM), HealthcareEntityDataSource(entity_id=10084268, name=MDR), ...
As you can see, in addition to just the list of entities, we also get the following:
- Enity Mapping of entities to standard medical ontologies, such as UMLS.
- Relations between entities inside the text, such as
TimeOfCondition, etc. - Negation, which indicated that an entity was used in negative context, for example COVID-19 diagnosis did not occur.
In addition to using Python SDK, you can also call Text Analytics using REST API directly. This is useful if you are using a programming language that does not have a corresponding SDK, or if you prefer to receive Text Analytics result in the JSON format for further storage or processing. In Python, this can be easily done using requests library:
uri = f"{endpoint}/text/analytics/v3.1-preview.3/entities/
         health/jobs?model-version=v3.1-preview.4"
headers = { "Ocp-Apim-Subscription-Key" : key }
resp = requests.post(uri,headers=headers,data=doc)
res = resp.json()
if res['status'] == 'succeeded':
    result = t['results']
else:
    result = None
(We need to make sure to use the preview endpoint to have access to text analytics for health)
Resulting JSON file will look like this:
{"id": "jk62qn0z",
 "entities": [
    {"offset": 24, "length": 28, "text": "coronavirus disease pandemic",
     "category": "Diagnosis", "confidenceScore": 0.98,
     "isNegated": false},
    {"offset": 54, "length": 8, "text": "COVID-19",
     "category": "Diagnosis", "confidenceScore": 1.0, "isNegated": false,
     "links": [
       {"dataSource": "UMLS", "id": "C5203670"},
       {"dataSource": "ICD10CM", "id": "U07.1"}, ... ]},
 "relations": [
    {"relationType": "Abbreviation", "bidirectional": true,
     "source": "#/results/documents/2/entities/6",
     "target": "#/results/documents/2/entities/7"}, ...],
}
Note: In production, you may want to incorporate some code that will retry the operation when an error is returned by the service. For more guidance on proper implementation of cognitive services REST clients, you can check source code of Azure Python SDK, or use Swagger to generate client code.
Using CosmosDB to Store Analysis Result
Using Python code similar to the one above we can extract JSON entity/relation metadata for each paper abstract. This process takes quite some time for 400K papers, and to speed it up it can be parallelized using technologies such as Azure Batch or Azure Machine Learning. However, in my first experiment I just run the script on one VM in the cloud, and the data was ready in around 11 hours.
Having done this, we have now obtained a collection of papers, each having a number of entities and corresponding relations. This structure is inherently hierarchical, and the best way to store and process it would be to use NoSQL approach for data storage. In Azure, Cosmos DB is a universal database that can store and query semi-structured data like our JSON collection, thus it would make sense to upload all JSON files to CosmosDB collection. This can be done using the following code:
coscli = azure.cosmos.CosmosClient(cosmos_uri, credential=cosmos_key)
cosdb = coscli.get_database_client("CORD")
cospapers = cosdb.get_container_client("Papers")
for x in all_papers_json:
    cospapers.upsert_item(x)
Here, all_papers_json is a variable (or generator function) containing individual JSON documents for each paper. We also assume that you have created a Cosmos DB database called ‘CORD’, and obtained required credentials into cosmos_uri and cosmos_key variables.
After running this code, we will end up with the container Papers will all metadata. We can now work with this container in Azure Portal by going to Data Explorer: 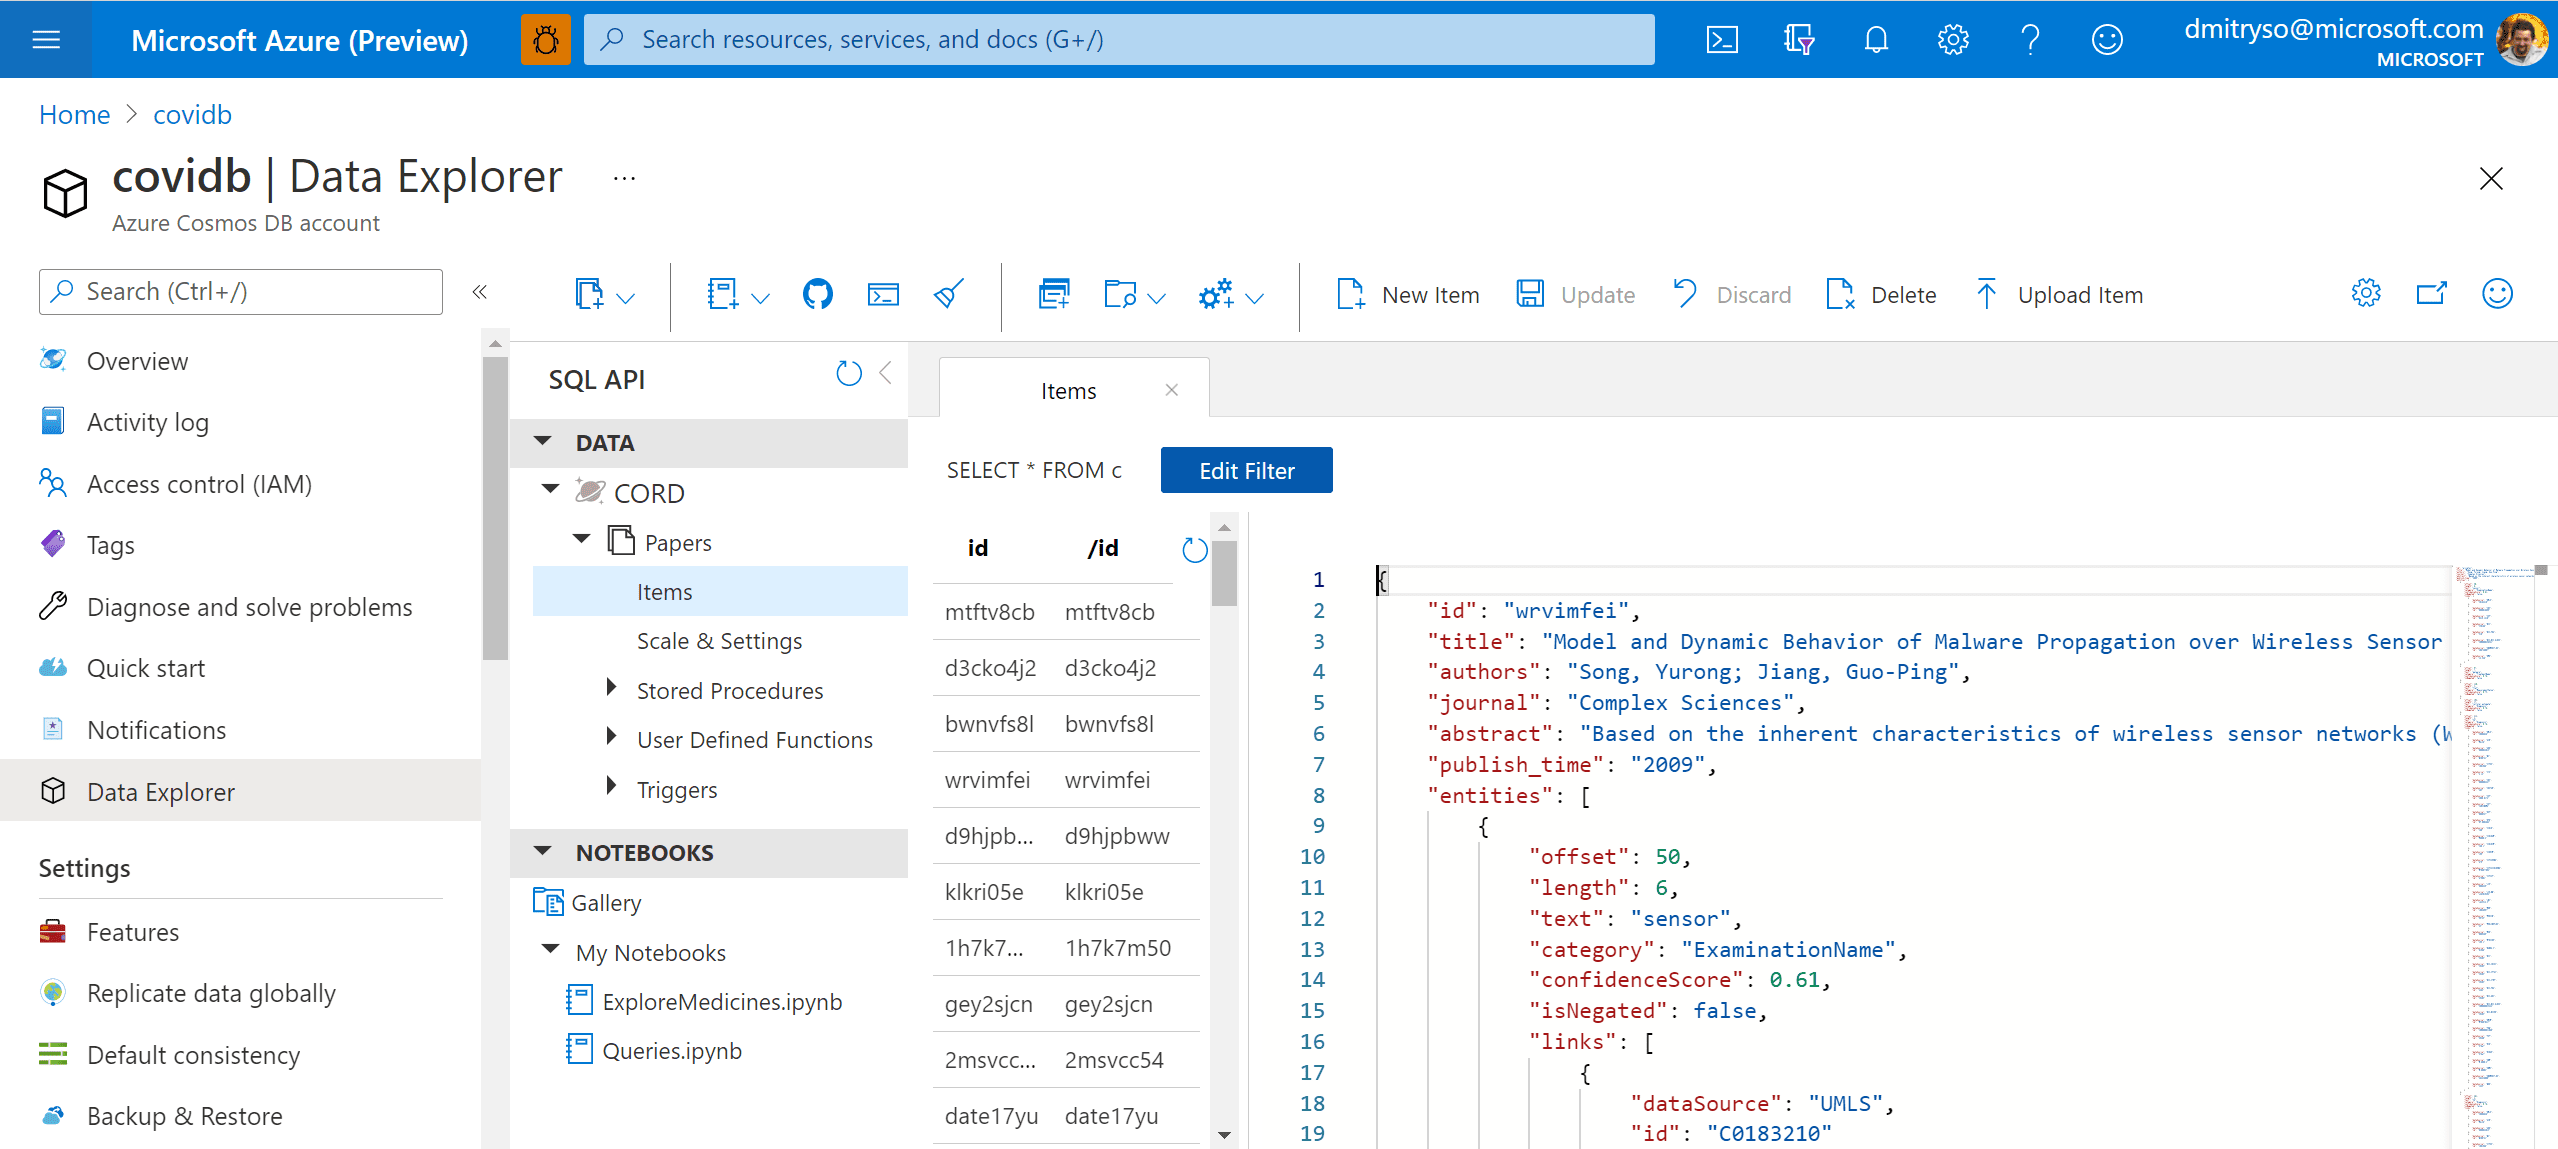
Now we can use Cosmos DB SQL in order to query our collection. For example, here is how we can obtain the list of all medications found in the corpus:
-- unique medication names
SELECT DISTINCT e.text
FROM papers p
JOIN e IN p.entities
WHERE e.category='MedicationName'
Using SQL, we can formulate some very specific queries. Suppose, a medical specialist wants to find out all proposed dosages of a specific medication (say, hydroxychloroquine), and see all papers that mention those dosages. This can be done using the following query:
-- dosage of specific drug with paper titles
SELECT p.title, r.source.text
FROM papers p JOIN r IN p.relations
WHERE r.relationType='DosageOfMedication'
AND CONTAINS(r.target.text,'hydro')
A more difficult task would be to select all entities together with their corresponding ontology ID. This would be extremely useful, because eventually we want to be able to refer to a specific entity (hydroxychloroquine) regardless or the way it was mentioned in the paper (for example, HCQ also refers to the same medication). We will use UMLS as our main ontology.
--- get entities with UMLS IDs
SELECT e.category, e.text,
  ARRAY (SELECT VALUE l.id
         FROM l IN e.links
         WHERE l.dataSource='UMLS')[0] AS umls_id
FROM papers p JOIN e IN p.entities
Creating Interactive Dashboards
While being able to use SQL query to obtain an answer to some specific question, like medication dosages, seems like a very useful tool - it is not convenient for non-IT professionals, who do not have high level of SQL mastery. To make the collection of metadata accessible to medical professionals, we can use PowerBI tool to create an interactive dashboard for entity/relation exploration.
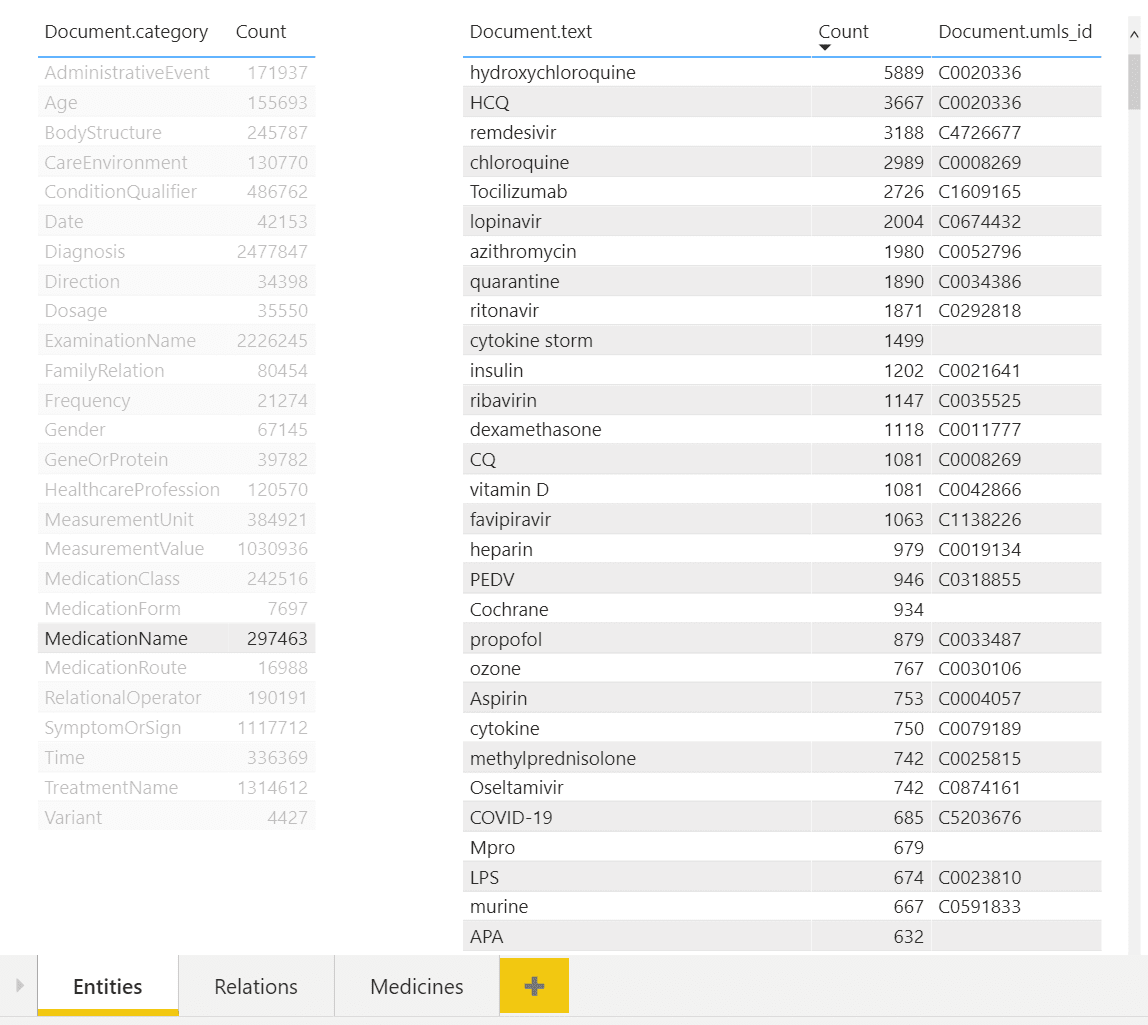
In the example above, you can see a dashboard of different entities. One can select desired entity type on the left (eg. Medication Name in our case), and observe all entities of this type on the right, together with their count. You can also see associated UMLS IDs in the table, and from the example above once can notice that several entities can refer to the same ontology ID (hydroxychloroquine and HCQ).
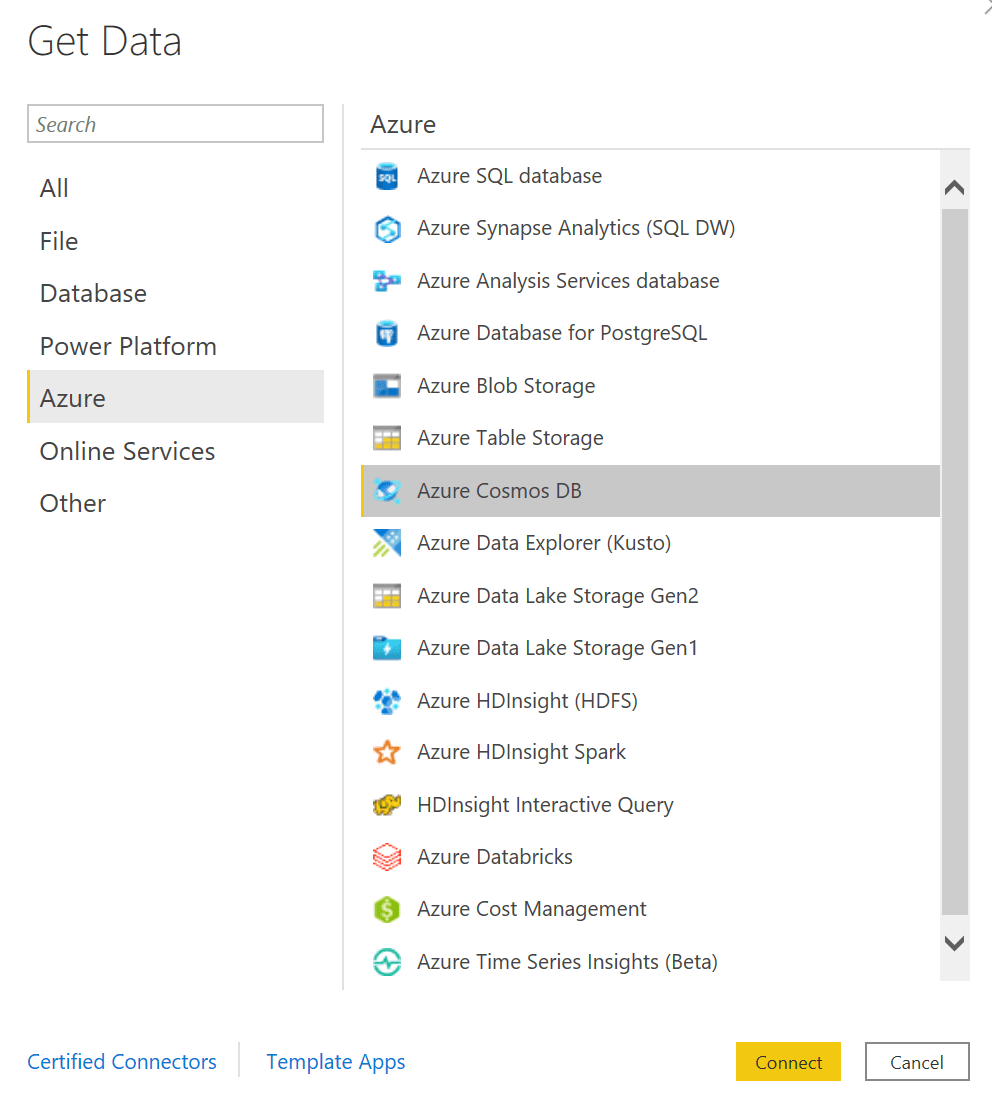
To make this dashboard, we need to use PowerBI Desktop. First we need to import Cosmos DB data - the tools support direct import of data from Azure.
Then we provide SQL query to get all entities with the corresponding UMLS IDs - the one we have shown above - and one more query to display all unique categories. Then we drag those two tables to the PowerBI canvas to get the dashboard shown above. The tool automatically understands that two tables are linked by one field named category, and supports the functionality to filter second table based on the selection in the first one.
Similarly, we can create a tool to view relations:
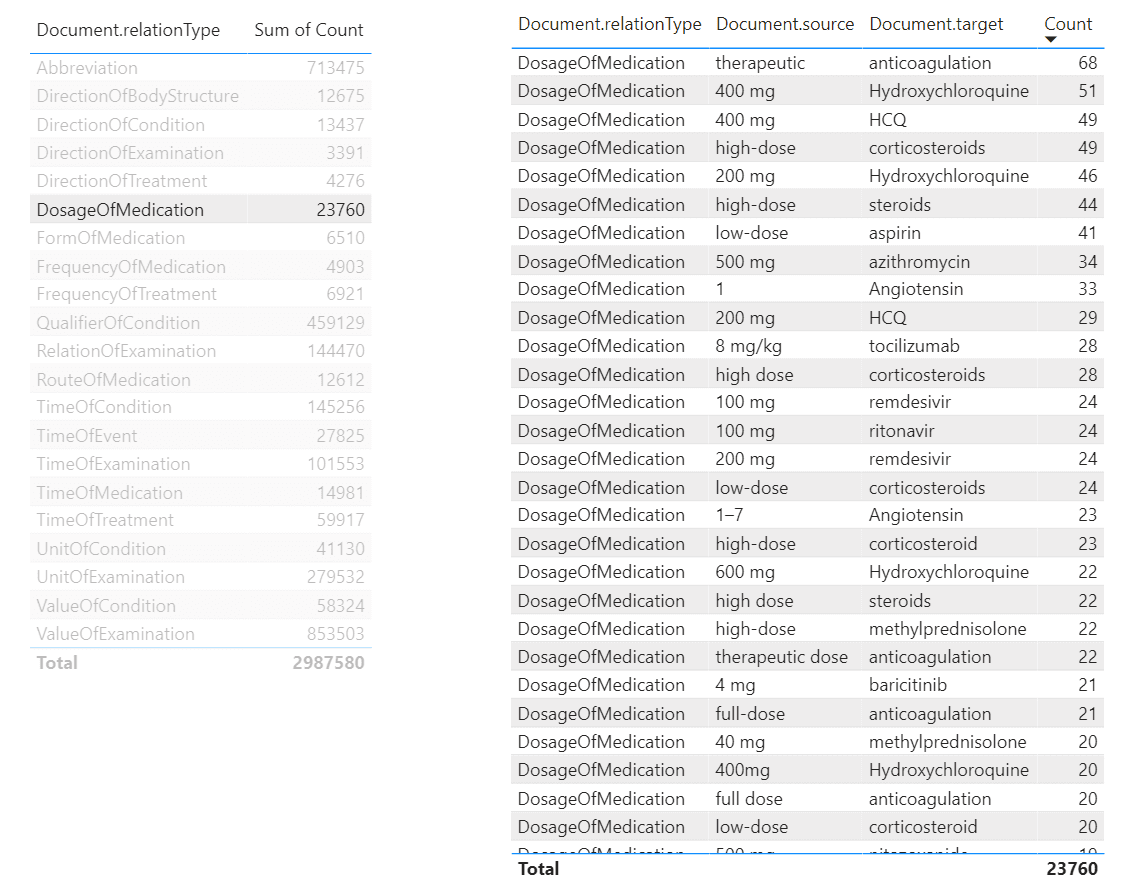
From this tool, we can make queries similar to the one we have made above in SQL, to determine dosages of a specific medications. To do it, we need to select DosageOfMedication relation type in the left table, and then filter the right table by the medication we want. It is also possible to create further drill-down tables to display specific papers that mention selected dosages of medication, making this tool a useful research instrument for medical scientist.
Getting Automatic Insights
The most interesting part of the story, however, is to draw some automatic insights from the text, such as the change in medical treatment strategy over time. To do this, we need to write some more code in Python to do proper data analysis. The most convenient way to do that is to use Notebooks embedded into Cosmos DB:
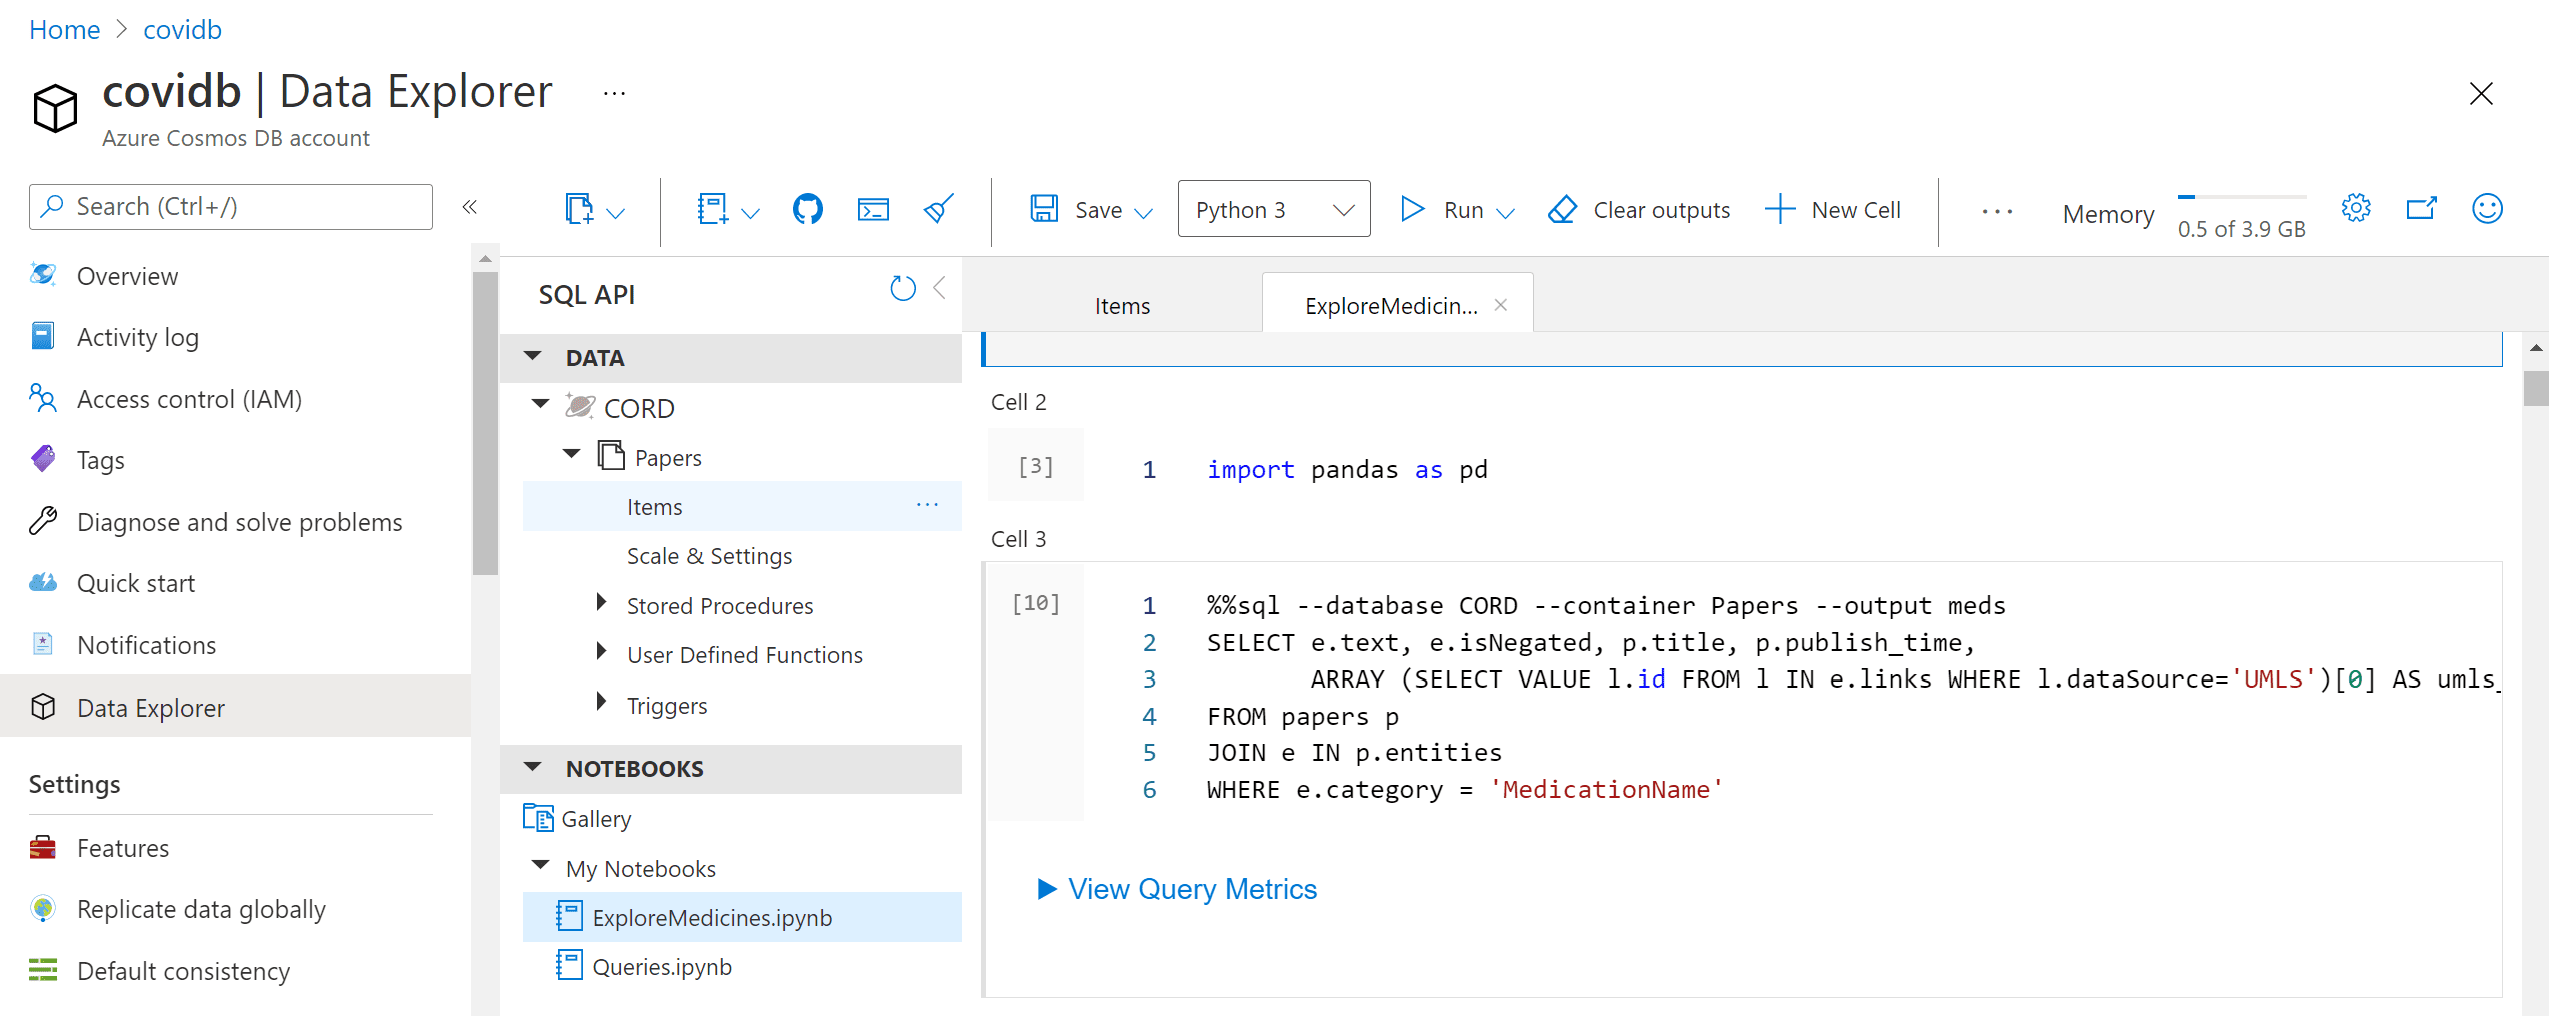
Those notebooks support embedded SQL queries, thus we are able to execute SQL query, and then get the results into Pandas dataframe, which is Python-native way to explore data:
%%sql --database CORD --container Papers --output meds
SELECT e.text, e.isNegated, p.title, p.publish_time,
       ARRAY (SELECT VALUE l.id FROM l
              IN e.links
              WHERE l.dataSource='UMLS')[0] AS umls_id
FROM papers p
JOIN e IN p.entities
WHERE e.category = 'MedicationName'
Here we end up with meds DataFrame, containing names of medicines, together with corresponding paper titles and publishing date. We can further group by ontology ID to get frequencies of mentions for different medications:
unimeds = meds.groupby('umls_id') \
              .agg({'text' : lambda x : ','.join(x),
                    'title' : 'count',
                    'isNegated' : 'sum'})
unimeds['negativity'] = unimeds['isNegated'] / unimeds['title']
unimeds['name'] = unimeds['text'] \
                  .apply(lambda x: x if ',' not in x
                                     else x[:x.find(',')])
unimeds.sort_values('title',ascending=False).drop('text',axis=1)
This gives us the following table:
| umls_id | title | isNegated | negativity | name |
|---|
| C0020336 | 4846 | 191 | 0.039414 | hydroxychloroquine |
| C0008269 | 1870 | 38 | 0.020321 | chloroquine |
| C1609165 | 1793 | 94 | 0.052426 | Tocilizumab |
| C4726677 | 1625 | 24 | 0.014769 | remdesivir |
| C0052796 | 1201 | 84 | 0.069942 | azithromycin |
| … | … | … | … | … |
| C0067874 | 1 | 0 | 0.000000 | 1-butanethiol |
From this table, we can select the top-15 most frequently mentioned medications:
top = {
    x[0] : x[1]['name'] for i,x in zip(range(15),
      unimeds.sort_values('title',ascending=False).iterrows())
}
To see how frequency of mentions for medications changed over time, we can average out the number of mentions for each month:
# First, get table with only top medications
imeds = meds[meds['umls_id'].apply(lambda x: x in top.keys())].copy()
imeds['name'] = imeds['umls_id'].apply(lambda x: top[x])

# Create a computable field with month
imeds['month'] = imeds['publish_time'].astype('datetime64[M]')

# Group by month
medhist = imeds.groupby(['month','name']) \
          .agg({'text' : 'count',
                'isNegated' : [positive_count,negative_count] })
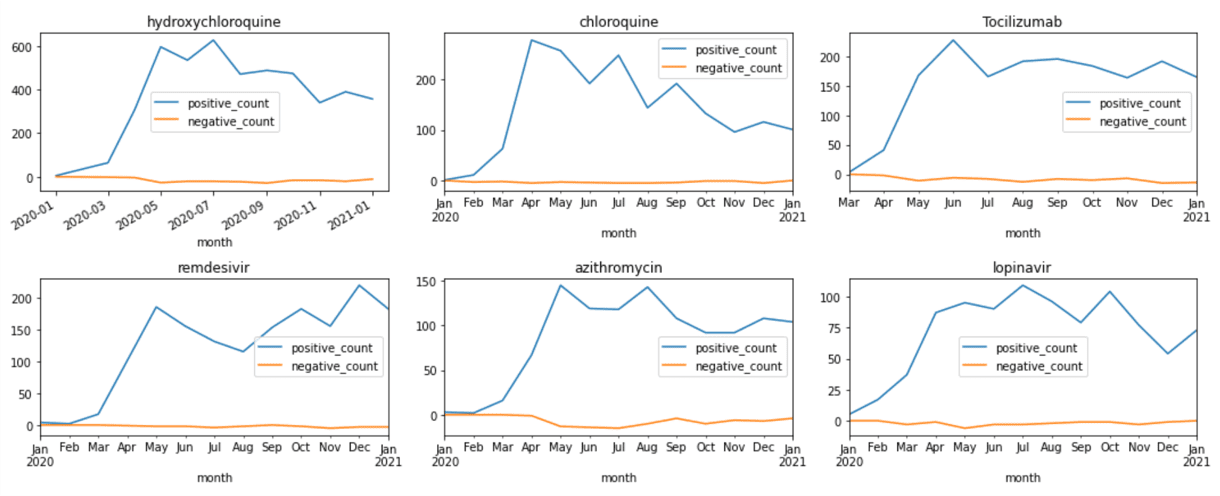
This gives us the DataFrame that contains number of positive and negative mentions of medications for each month. From there, we can plot corresponding graphs using matplotlib:
medh = medhist.reset_index()
fig,ax = plt.subplots(5,3)
for i,n in enumerate(top.keys()):
    medh[medh['name']==top[n]] \
    .set_index('month')['isNegated'] \
    .plot(title=top[n],ax=ax[i//3,i%3])
fig.tight_layout()
Visualizing Terms Co-Occurrence
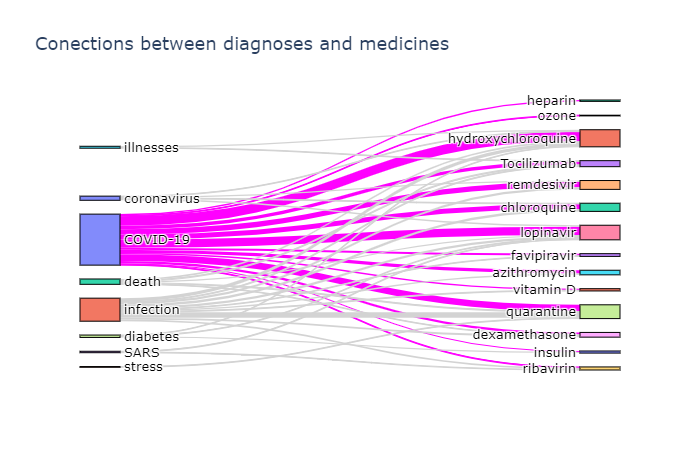
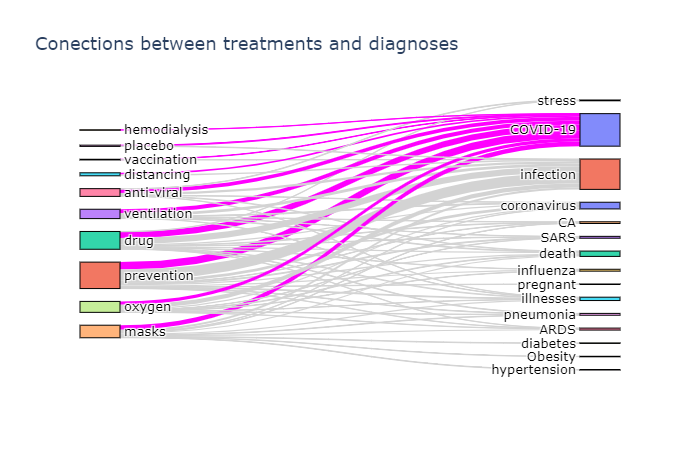
Another interesting insight is to observe which terms occur frequently together. To visualize such dependencies, there are two types of diagrams:
- Sankey diagram allows us to investigate relations between two types of terms, eg. diagnosis and treatment
- Chord diagram helps to visualize co-occurrence of terms of the same type (eg. which medications are mentioned together)
To plot both diagrams, we need to compute co-occurrence matrix, which in the row i and column j contains number of co-occurrences of terms i and j in the same abstract (one can notice that this matrix is symmetric). The way we compute it is to manually select relatively small number of terms for our ontology, grouping some terms together if needed:
treatment_ontology = {
 'C0042196': ('vaccination',1),
 'C0199176': ('prevention',2),
 'C0042210': ('vaccines',1), ... }

diagnosis_ontology = {
 'C5203670': ('COVID-19',0),
 'C3714514': ('infection',1),
 'C0011065': ('death',2),
 'C0042769': ('viral infections',1),
 'C1175175': ('SARS',3),
 'C0009450': ('infectious disease',1), ...}
Then we define a function to compute co-occurrence matrix for two categories specified by those ontology dictionaries:
def get_matrix(cat1, cat2):
    d1 = {i:j[1] for i,j in cat1.items()}
    d2 = {i:j[1] for i,j in cat2.items()}
    s1 = set(cat1.keys())
    s2 = set(cat2.keys())
    a = np.zeros((len(cat1),len(cat2)))
    for i in all_papers:
        ent = get_entities(i)
        for j in ent & s1:
            for k in ent & s2 :
                a[d1[j],d2[k]] += 1
    return a
Here get_entities function returns the list of UMLS IDs for all entities mentioned in the paper, and all_papers is the generator that returns the complete list of paper abstracts metadata.
To actually plot the Sankey diagram, we can use Plotly graphics library. This process is well described here, so I will not go into further details. Here are the results:
Plotting a chord diagram cannot be easily done with Plotly, but can be done with a different library - Chord. The main idea remains the same - we build co-occurrence matrix using the same function described above, passing the same ontology twice, and then pass this matrix to Chord:
def chord(cat):
    matrix = get_matrix(cat,cat)
    np.fill_diagonal(matrix,0)
    names = cat.keys()
    Chord(matrix.tolist(), names, font_size = "11px").to_html()
The results of chord diagrams for treatment types and medications are below:
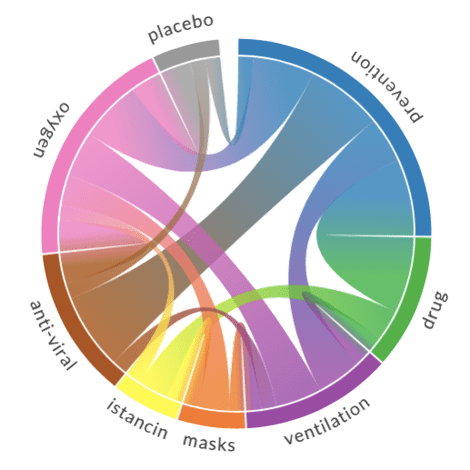 | 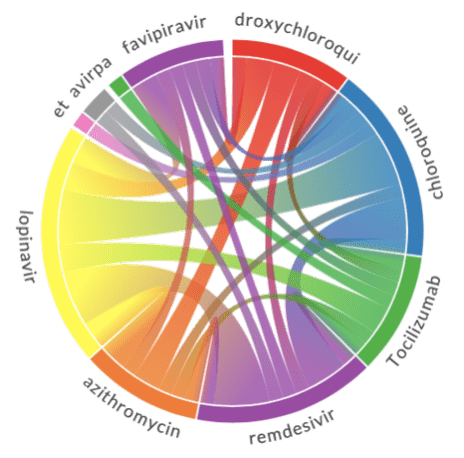 |
| Treatment types | Medications |
Diagram on the right shows which medications are mentioned together (in the same abstract). We can see that well-known combinations, such as hydroxychloroquine + azitromycin, are clearly visible.
Conclusion
In this post, we have described the architecture of a proof-of-concept system for knowledge extraction from large corpora of medical texts. We use Text Analytics for Health to perform the main task of extracting entities and relations from text, and then a number of Azure services together to build a query took for medical scientist and to extract some visual insights. This post is quite conceptual at the moment, and the system can be further improved by providing more detailed drill-down functionality in PowerBI module, as well as doing more data exploration on extracted entity/relation collection. It would also be interesting to switch to processing full-text articles as well, in which case we need to think about slightly different criteria for co-occurrence of terms (eg. in the same paragraph vs. the same paper).
The same approach can be applied in other scientific areas, but we would need to be prepared to train a custom neural network model to perform entity extraction. This task has been briefly outlined above (when we talked about the use of BERT), and I will try to focus on it in one of my next posts. Meanwhile, feel free to reach out to me if you are doing similar research, or have any specific questions on the code and/or methodology.